Overview
The article emphasizes the unique features and critical uses of the depth map of Lake Tahoe, showcasing its geological characteristics and ecological significance. This depth map is indispensable for navigation, environmental research, and recreational planning, as it delivers essential insights into the lake's underwater terrain and biodiversity. Furthermore, it highlights the impacts of human activities, thereby reinforcing the need for effective management and conservation efforts. By understanding the depth map's value, stakeholders can make informed decisions that support the preservation of this vital ecosystem.
Introduction
The underwater world of Lake Tahoe stands as one of North America's most captivating enigmas, with its depth map unveiling a sophisticated tapestry of geological features and ecological importance. This article explores the diverse applications of depth maps, underscoring their essential function for researchers, navigators, and environmentalists alike. Yet, as clarity wanes and ecological challenges escalate, one must consider: how can these intricate representations contribute to the preservation of the lake's unique ecosystem while simultaneously enhancing recreational opportunities?
Define Depth Map: An Overview of Lake Tahoe's Topography
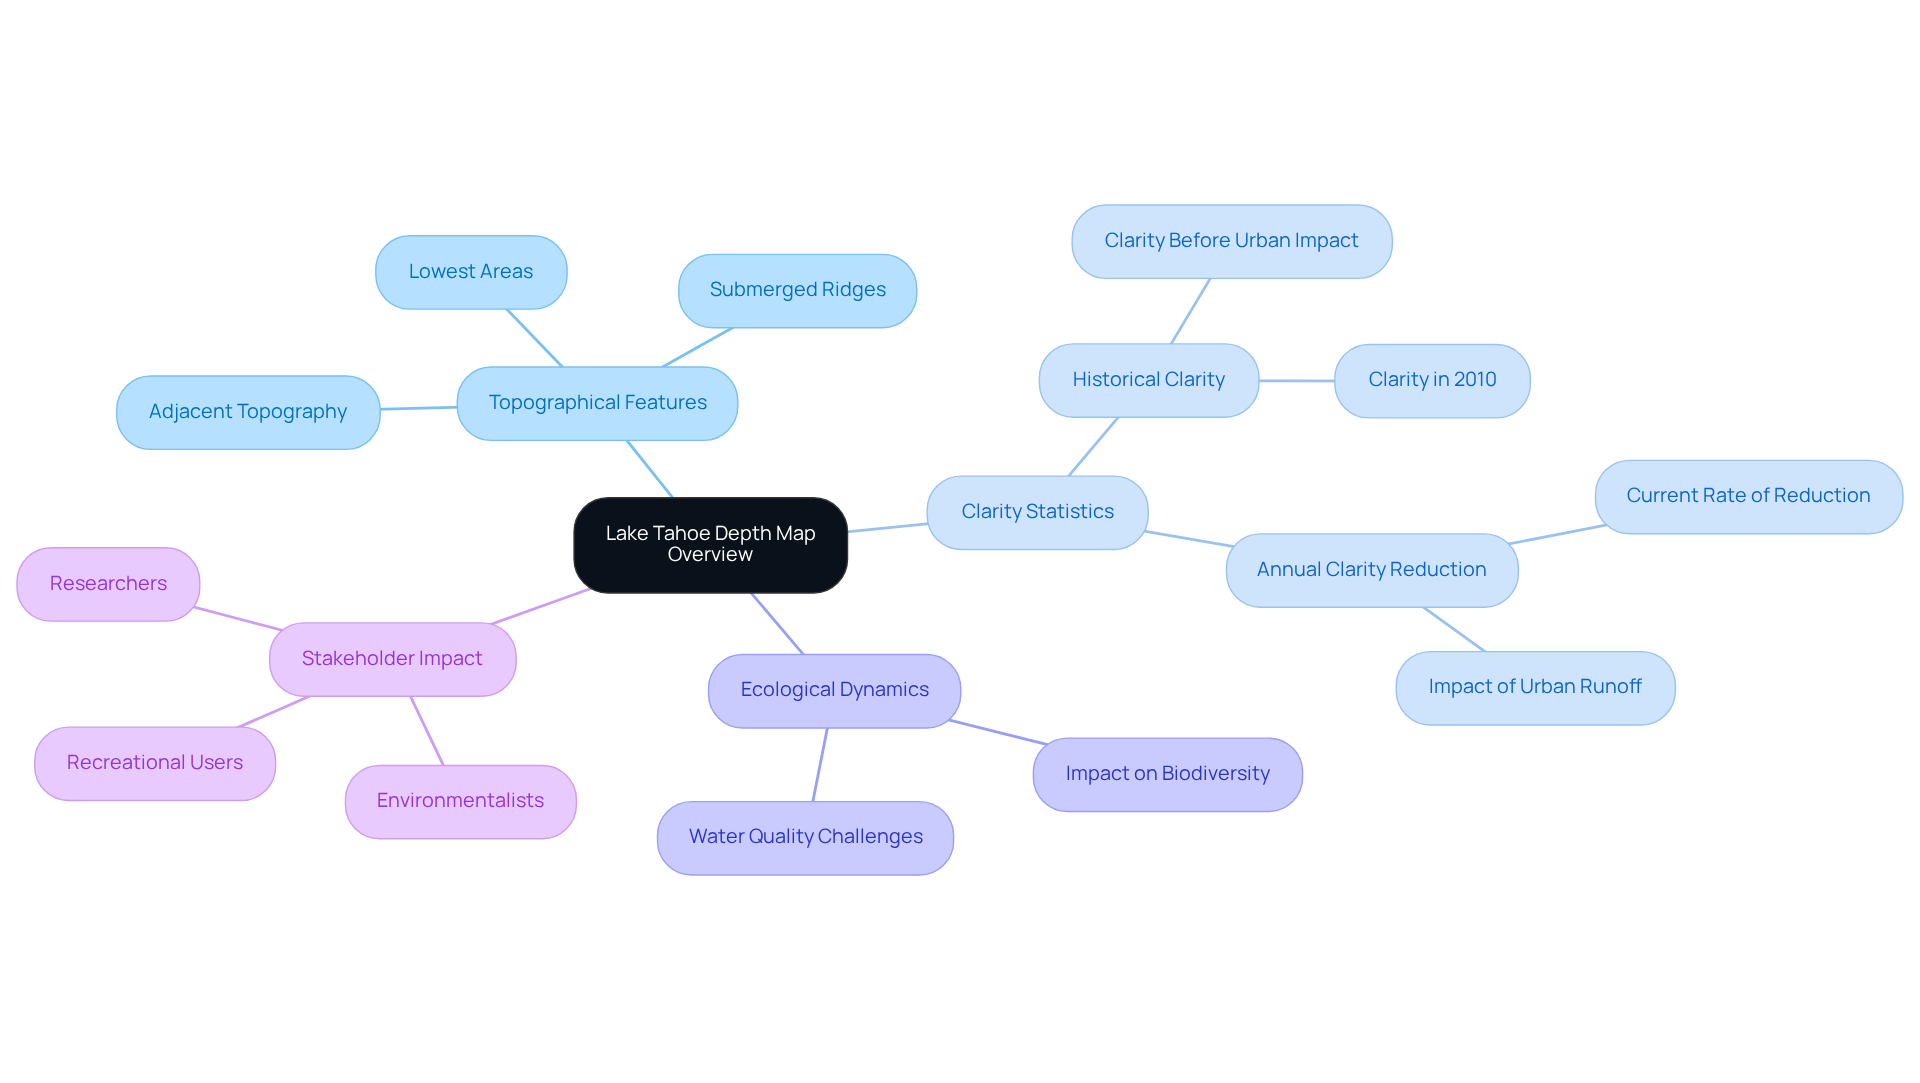
A terrain map serves as a specialized depiction of the subaqueous topography of a body of water, illustrating the variations in elevation across diverse locations. In the case of Lake Tahoe, a measurement chart reveals the depth map of Lake Tahoe, showcasing the water body's distinctive geological characteristics, including its lowest areas, submerged ridges, and adjacent topography. This visual representation is crucial for numerous stakeholders—researchers, environmentalists, and recreational users alike—offering insights into the physical characteristics of the water body while aiding in the understanding of its ecological dynamics.
The clarity map of Tahoe stands out for its remarkable sharpness and detail, underscoring the body of water's status as one of the deepest and clearest in North America. Researchers have documented that Lake Tahoe has mixed to a depth of at least 1,300 feet a total of six or seven times since 1970, emphasizing its complex underwater landscape. Furthermore, the average rate of clarity reduction in Lake Tahoe is 0.82 feet (0.25 m) annually, a statistic that underscores the ecological challenges faced by the body of water. Historically, Tahoe's clarity was approximately 98 feet (30 m) prior to urban sources contributing to clarity loss, providing valuable context for understanding the current ecological status of the lake.
Additionally, case studies regarding public trust easements and environmental protection initiatives highlight the significance of detailed representations in the realm of environmental management and public access rights. Understanding these characteristics is essential for effective environmental management and recreational planning, as the depth map of Lake Tahoe plays a vital role in comprehending the submerged terrain of the lake and its effects on biodiversity and water quality.

Explore Applications: Uses of Depth Maps in Navigation and Ecology
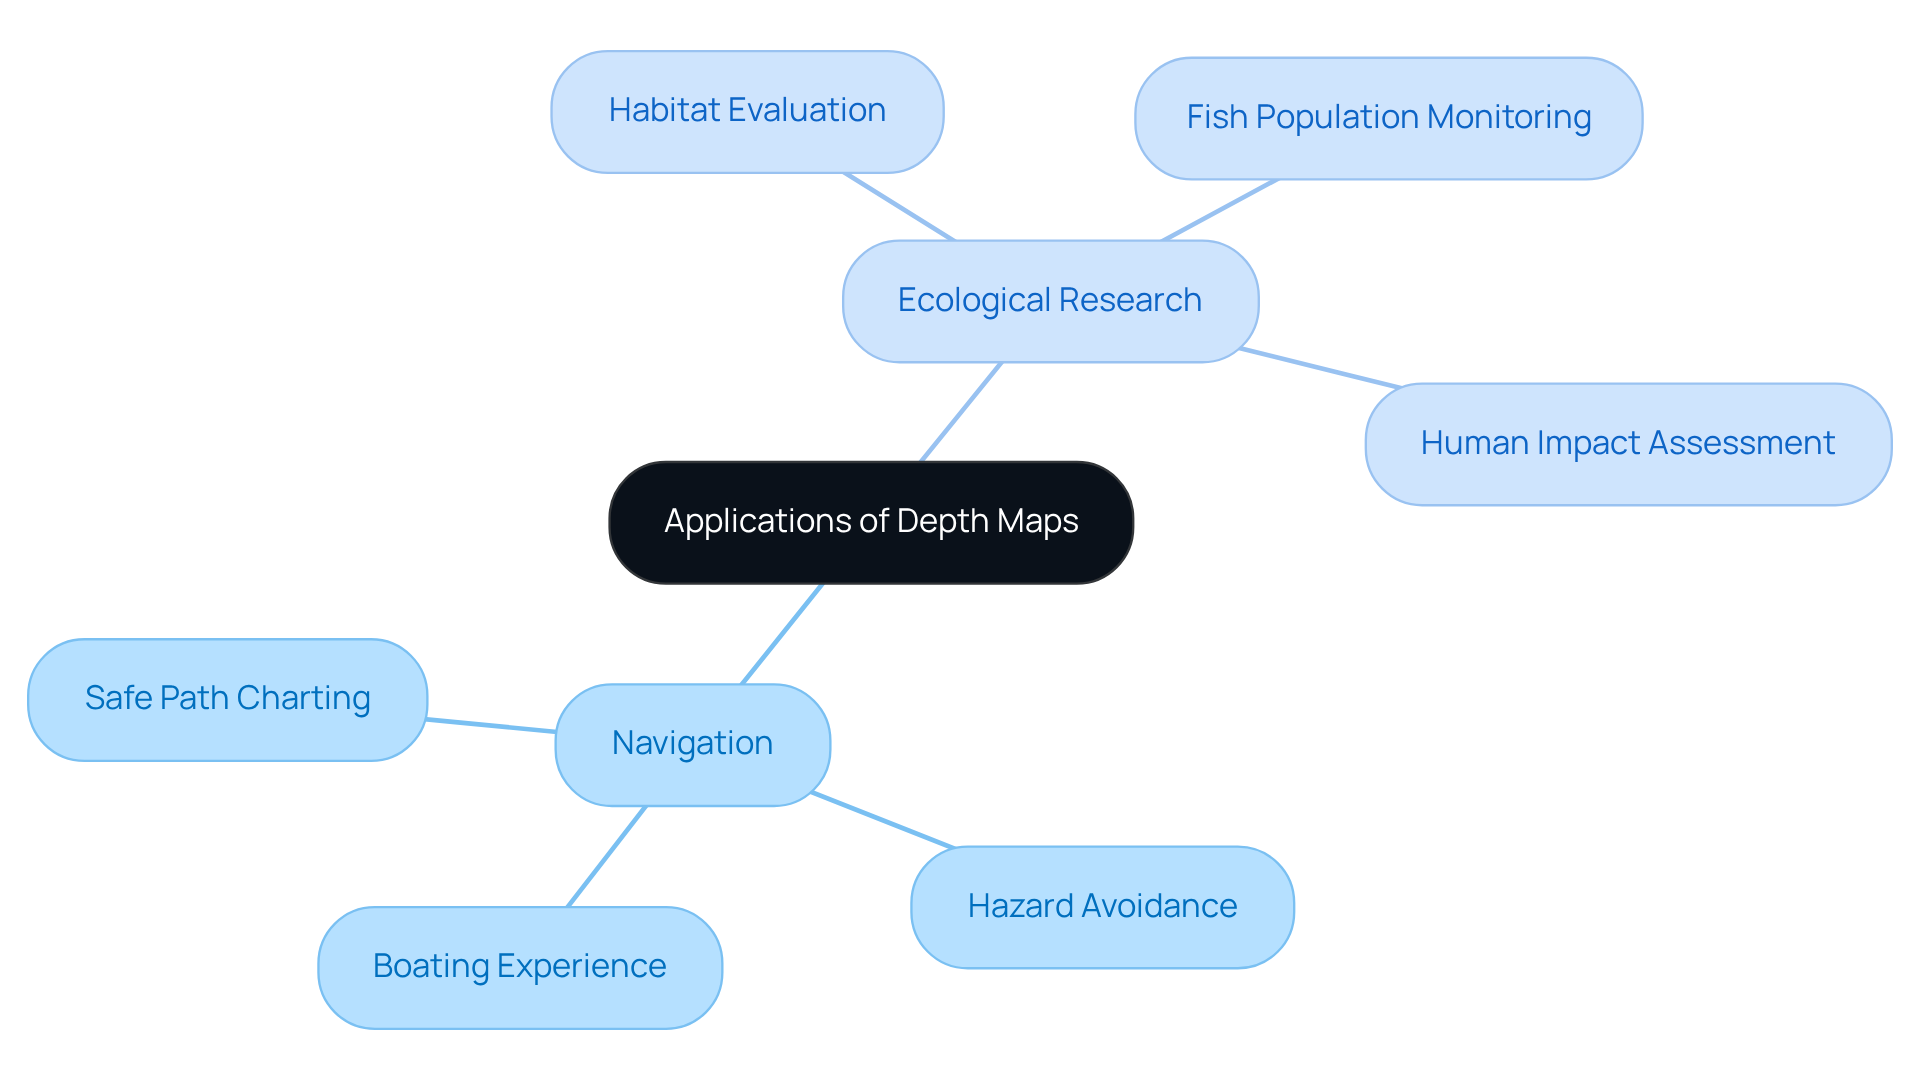
Depth representations are indispensable tools in navigation and ecological research. For navigators, these charts are vital instruments that facilitate the charting of safe paths, help avoid underwater hazards, and enhance the overall boating experience. In the realm of ecological research, bathymetric charts play a crucial role in evaluating habitats, monitoring fish populations, and understanding the impacts of human activities on aquatic ecosystems.
For instance, scientists studying Lake Tahoe utilize sonar charts to create a depth map of Lake Tahoe, allowing them to analyze the distribution of aquatic species and assess the health of the lake's ecosystem. Furthermore, spatial representations are instrumental in guiding conservation efforts by identifying critical habitats that require preservation, thus playing a pivotal role in sustainable environmental stewardship.
It is essential to recognize that the estimated underwater profiles, such as those developed for the Northwestern Hawaiian Islands between 2000 and 2002, are not designed for navigation. These charts employ specific RGB color profiles to illustrate underwater terrain, providing a visual understanding of submerged topography. The collaborative efforts behind these maps, involving organizations like NOAA, significantly enhance their credibility and relevance in ecological research.

Examine Features: Geological and Ecological Aspects of Lake Tahoe's Depth Map
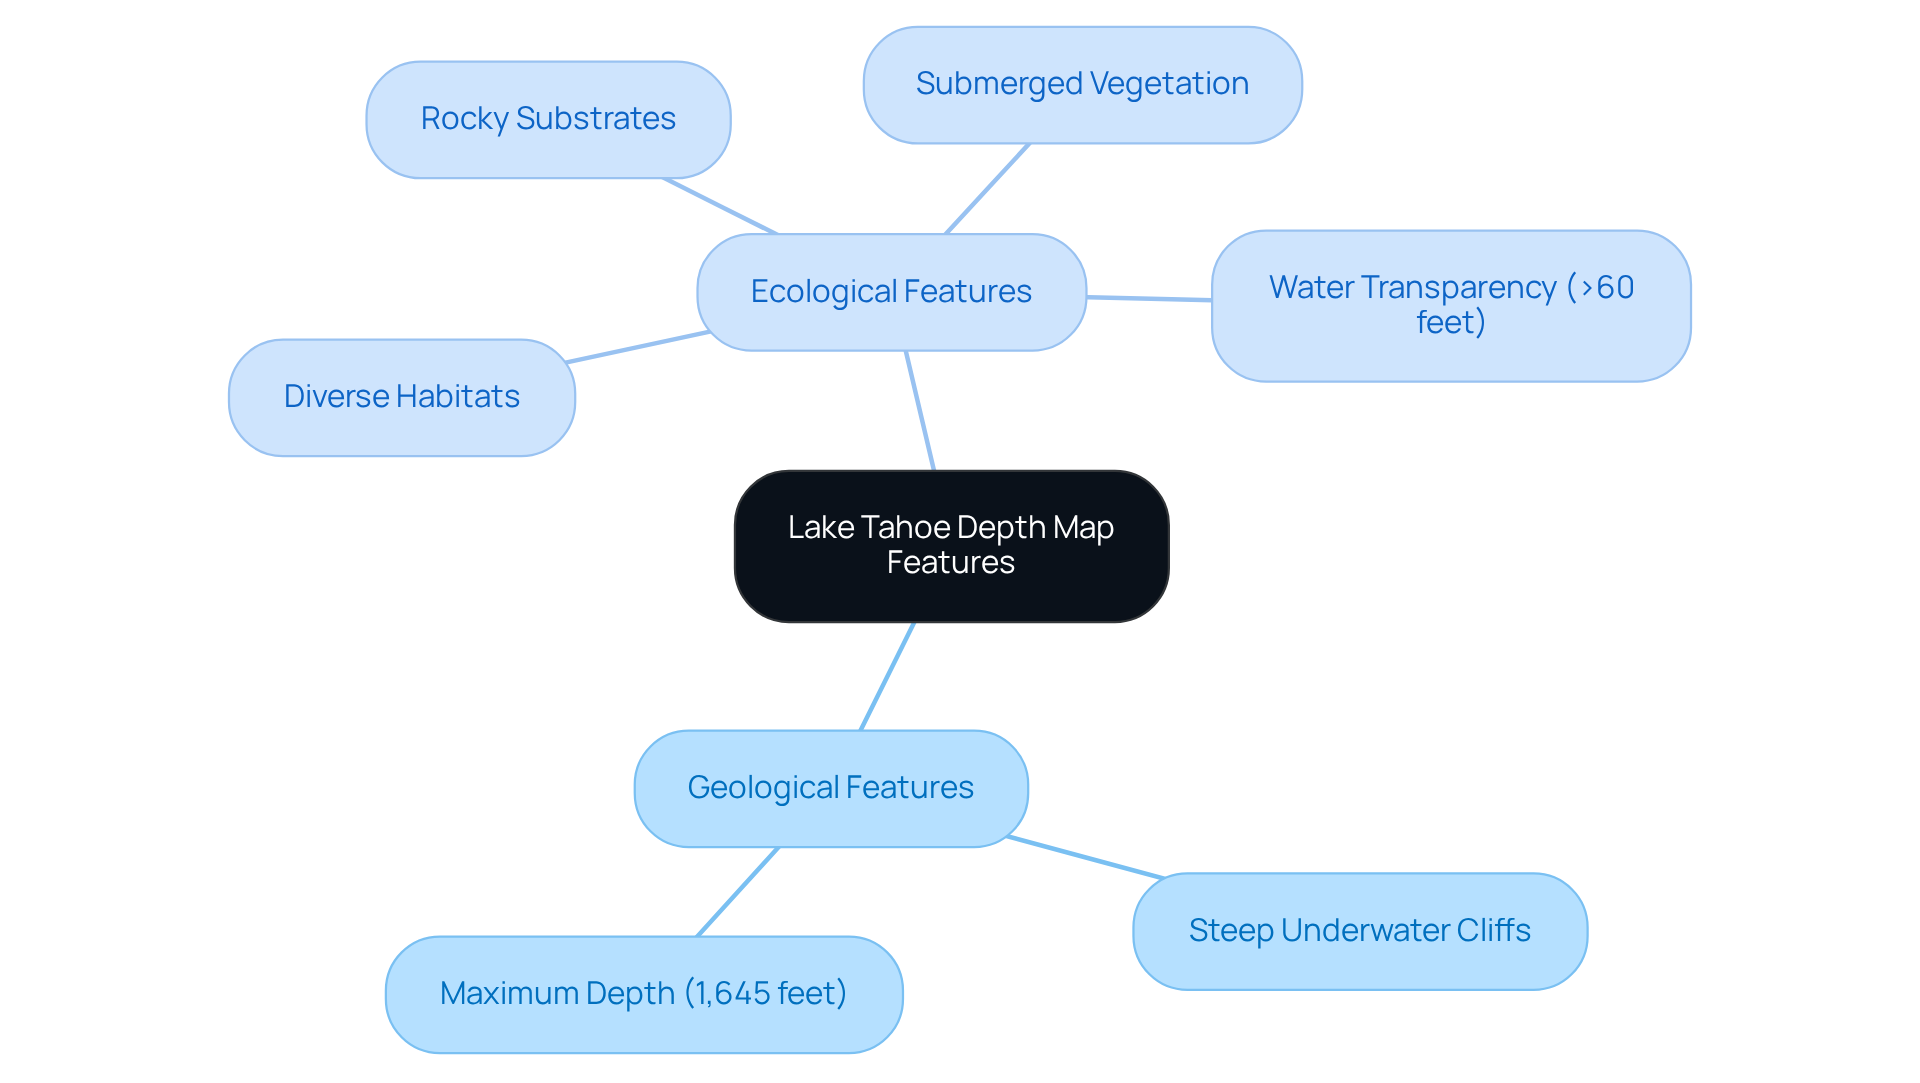
The terrain map of Tahoe distinctly showcases several geological and ecological characteristics that are crucial for understanding the area's environment.
Geologically, this remarkable body of water is characterized by steep underwater cliffs, and the depth map of Lake Tahoe reveals that it reaches a maximum depth of approximately 1,645 feet, positioning it among the deepest bodies of water in the United States.
Ecologically, the contour map highlights diverse habitats, including rocky substrates and submerged vegetation, which are essential for supporting a rich array of aquatic life.
The water's impressive transparency, which can exceed 60 feet, allows sunlight to penetrate, fostering the growth of phytoplankton and sustaining the intricate food web of the ecosystem.
These features not only bolster the lake's ecological vitality but also enhance its recreational appeal, drawing visitors for activities such as fishing, boating, and swimming.

Trace History: Evolution of Depth Mapping Techniques
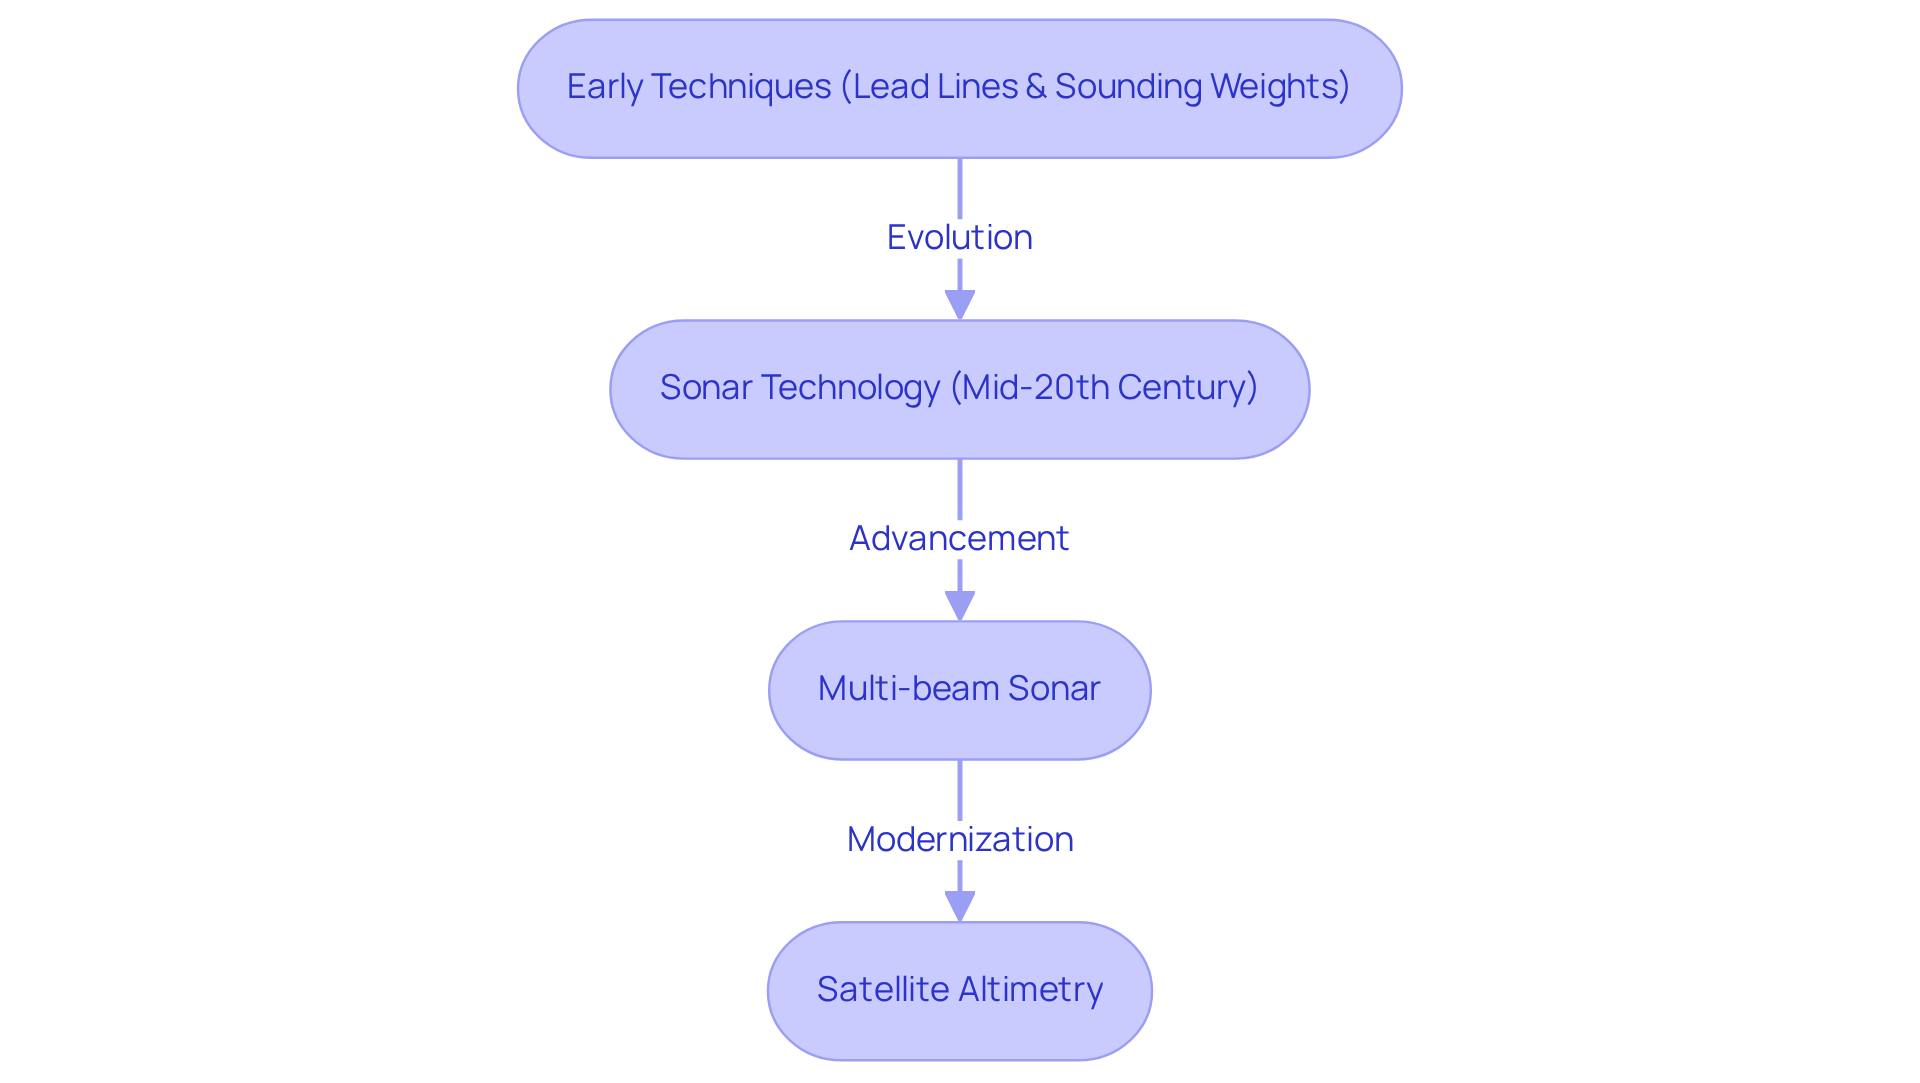
The evolution of measurement mapping methods has undergone significant transformations, driven by technological innovations and an increasing demand for precise aquatic data. Early techniques, which relied on simple lead lines and sounding weights, offered limited insights into underwater topography. However, with the advent of sonar technology in the mid-20th century, underwater mapping became markedly more accurate and effective, allowing for the creation of a depth map of Lake Tahoe and enabling comprehensive examinations of extensive water bodies.
Today, advanced methods such as multi-beam sonar and satellite altimetry empower researchers to create highly detailed and precise underwater profiles. This advancement not only enhances our understanding of aquatic environments but also plays a crucial role in informing conservation efforts and improving recreational activities. This historical perspective underscores the vital importance of the depth map of Lake Tahoe in contemporary ecological research and navigation.

Conclusion
Understanding the depth map of Lake Tahoe reveals not only the intricate underwater landscape of this remarkable body of water but also its ecological significance and the challenges it faces. This depth map serves as a vital tool for researchers, environmentalists, and recreational users, providing crucial insights into the geological features and ecological dynamics that define Lake Tahoe.
The importance of depth maps in navigation and ecological research is paramount. They highlight the geological and ecological characteristics of the terrain, showcasing the lake's steep underwater cliffs and diverse habitats. Moreover, the evolution of mapping techniques has significantly enhanced our understanding of aquatic environments. The depth map illustrates ongoing challenges related to water clarity and ecological health, emphasizing the urgent need for sustainable management practices.
Recognizing the depth map of Lake Tahoe as more than just a scientific tool is essential; it acts as a gateway to understanding the delicate balance of this ecosystem. As stakeholders engage with the lake's resources, a commitment to preserving its clarity and ecological integrity becomes vital. By leveraging the information provided by depth maps, communities can collaborate effectively to ensure that Lake Tahoe remains a vibrant and sustainable environment for future generations.
Frequently Asked Questions
What is a depth map?
A depth map is a specialized depiction of the subaqueous topography of a body of water, illustrating variations in elevation across different locations.
What does the depth map of Lake Tahoe illustrate?
The depth map of Lake Tahoe showcases the water body's distinctive geological characteristics, including its lowest areas, submerged ridges, and adjacent topography.
Who benefits from the depth map of Lake Tahoe?
Researchers, environmentalists, and recreational users benefit from the depth map, as it provides insights into the physical characteristics of the lake and aids in understanding its ecological dynamics.
What is notable about the clarity map of Lake Tahoe?
The clarity map of Lake Tahoe is distinguished by its remarkable sharpness and detail, highlighting the lake's status as one of the deepest and clearest in North America.
How deep can Lake Tahoe get?
Lake Tahoe has been documented to have mixed to a depth of at least 1,300 feet a total of six or seven times since 1970.
What is the average rate of clarity reduction in Lake Tahoe?
The average rate of clarity reduction in Lake Tahoe is 0.82 feet (0.25 m) annually.
What was Lake Tahoe's clarity prior to urban sources contributing to clarity loss?
Historically, Lake Tahoe's clarity was approximately 98 feet (30 m) before urban sources began contributing to clarity loss.
Why are detailed representations like the depth map important for environmental management?
Detailed representations, such as the depth map of Lake Tahoe, are essential for effective environmental management and recreational planning, as they help in understanding the submerged terrain of the lake and its effects on biodiversity and water quality.


